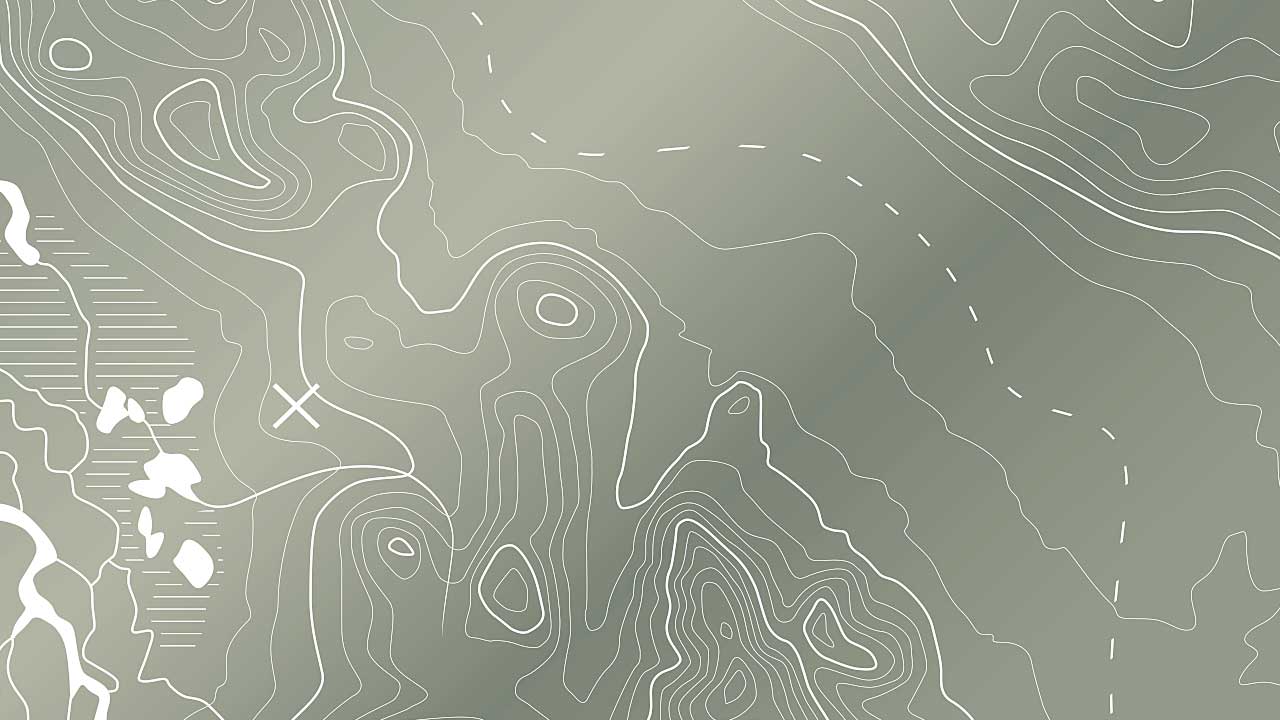
Contour lines, commonly used in topographic mapping, represent the information and details of a landform or geographical feature, such as the shape and height of a landscape. These lines highlight an area’s elevation, foliage, and bodies of water, as well as a variety of other symbols and markings to indicate both man-made and natural features.
While the use of contour and topographic maps are primarily for navigation, it is also a valuable tool for land surveyors, architects, and even BIM technicians. Understanding how a topographic map and contour lines are read is essential for efficient and safe planning across a variety of terrains. Here is a brief guide to contour mapping and how it applies to BIM training.
How to Read a Contour Map
A contour map is a key tool in defining and navigating a landscape, and the ability to understand and visualize the shape and height of geographical features is both a useful and necessary skill for students in BIM technician training. The typical contour map uses three main topographic markings to denote certain information like height, terrain, and man-made features: contour lines, color, and shading.
The numbers on contour lines read uphill in ascending order
Contour lines connect a series of elevated points and measure the height of the ground above mean sea level (MSL). The closer together the lines appear, the steeper the corresponding slope, and the farther apart, the gentler the slope. Flat terrain is indicated by lines that are separated by a significant amount of space.
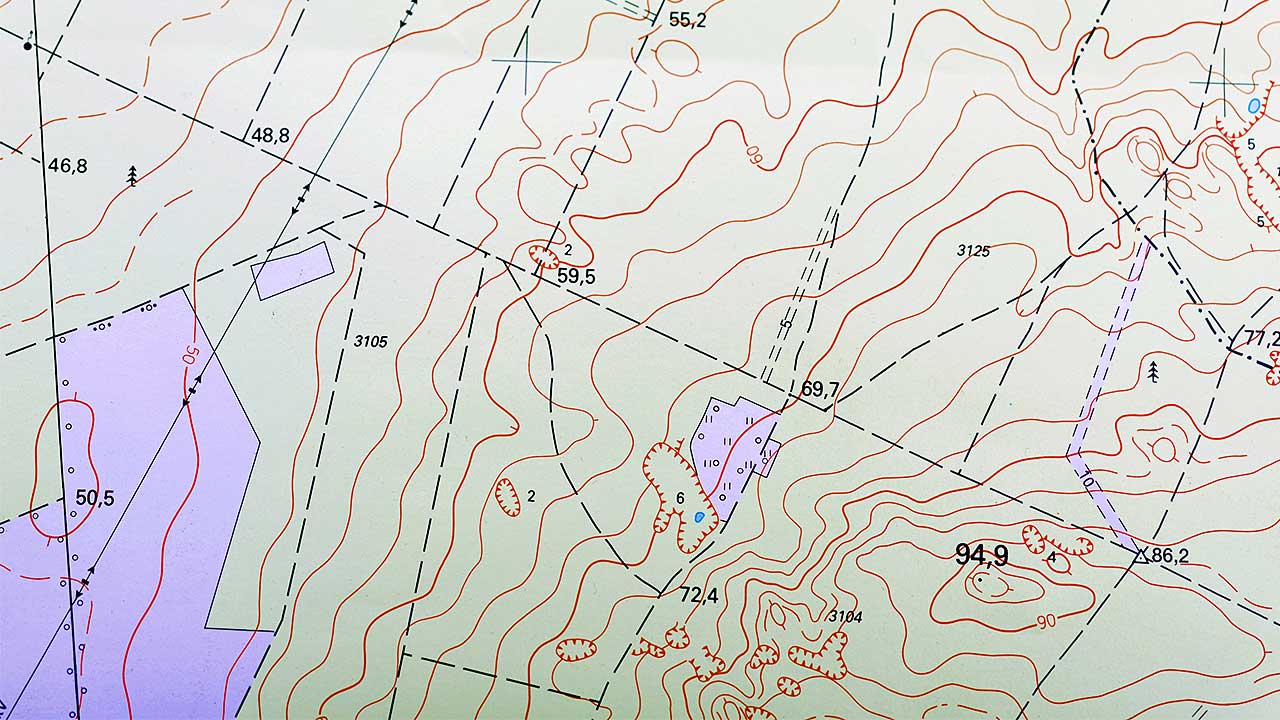
Just as contour lines demonstrate the height and elevation of a landscape, the color and shading of a map also point to important information. Contour lines are traditionally drawn in brown, while black denotes cultural or man-made features such as buildings and railways, green denotes vegetation and forestation, and blue represents the presence of water such as lakes and rivers. Color similarity, however, doesn’t necessarily mean that all the features are equivalent, and differences in shading indicate a change in terrain.
Contour Numbering, Slope, and Steepness
Contour lines also use a distinct style of numbering to further indicate elevation levels. When reading a topographic map, anyone who wants to become a BIM technician should know that smaller numbers correspond to well-spaced contour lines and gentler slopes, and the steeper the slope, the closer together the contour lines.
Contour lines follow points of equal height, and heavier indexed contour lines are typically numbered, while lighter intermediate lines do not have a given elevation and are used in sets of four between indexed lines to indicate general area and slope. Dashed lines are known as supplementary lines and are used to note minor changes in elevation.
Topographic Information and BIM Technician Training
Topographic information is relevant to an online BIM technician certificate because reading and interpreting the language of a contour map is part of a BIM technician’s duties, and how well they understand how the landscape influences and affects the task at hand.
Contour maps indicate not only the orientation and scale of a given geographical feature but the natural state of the environment and the potential challenges you may encounter when planning for a new project. Topographic information also includes what’s known as toponymy, or the names of places, landforms, and water features, and this can be referenced in print or as symbols which should be listed in the map legend. A map is only as useful as its interpreter, but when the proper knowledge is applied it becomes an invaluable tool to learn the details and specifics of any location.
Do you want to complete training for a rewarding career?
Fill out the form to get started!