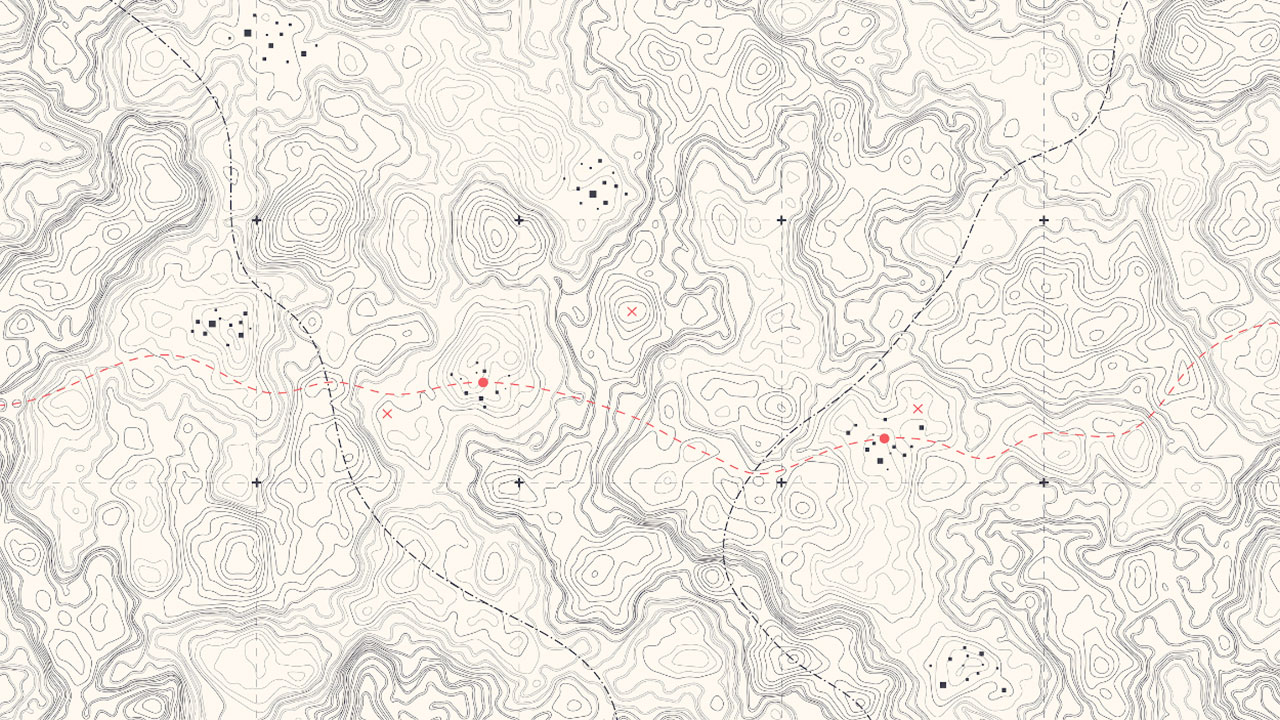
For any engineering technician, knowing how to read contour maps is a useful piece of knowledge to have. Contour maps—also known as topographic maps—allow those drawing them to make a map while using only two dimensions to show what they intend on doing with three. In some cases, contour maps are especially useful if it is difficult to draw 3D maps, and particularly if they’re difficult to map out by hand. They are often used to indicate lines of elevated surfaces, or more specifically, their altitude.
In any case, it’s important to remember how to read them before thinking of how to use them once you’ve gained experience in the field. Here’s what you should know about contour maps while pursuing your passion for engineering design technology. What Are Contour Maps? And What Should We Know About Them?
Contour lines first began appearing widely on maps during the 1800s. Essentially, a contour or topographic map indicates a three-dimensional design of a specific geographical area on a map that only allows for two dimensions. The ability to read contour lines is to understand the height of a specific point on a map relative to sea level since various equally elevated points are connected depending on the nature of the terrain it represents. Contour lines on a map indicate how much an area of a map is elevated to a certain height and the shape of the terrain around it. This also shows how flat or elevated a specific area is, as contour lines are meant to connect elevation points.
Any series of contour lines on a map includes contour intervals, which demonstrates how much each line changes its elevation level. Those looking for a career in engineering design technology should also note that contour lines can be characterized by several types of patterns. These include valleys, which feature upward-pointing lines shaped like a V, and hills, whose closed contour lines indicate they are on a steeper uphill slope. Peaks can be identified through concentric lines, while a saddle between two peaks can be detected by-lines in the shape of an hourglass.
Examples of Ways in Which Contour Maps Are Used, and Their Purpose
One of the most common uses for contour mapping is demonstrating how much altitude a geographical landscape has. Contour mapping can also be used for designs with waves, straight lines, or a paraboloid (a 3D-shaped parabola). There are also various kinds of line formations, such as peak and depression rings, which indicate the highest and lowest elevation points respectively.
Technical design school students should also know the difference between the different types of lines on a contour map. They can typically be defined in three different ways: index, intermediate, and supplementary. Index lines feature a number written along them signifying its elevation, are thick in nature and found on every fifth contour line. Intermediate lines are thin lines without numbers, while supplementary lines are dotted.

Contour maps involve interpreting a 3D map in 2D form
Why Contour Maps Are Important for Technical Design School Students to Learn
Contour maps are important to learn about because they allow us to see how three-dimensional maps can be interpreted using two, and understand the shape or depth belonging to different types of terrain. Their importance is also in how they can indicate the altitude or steepness of a map, depending on how close or far apart the lines are. More specifically, lines that are widely spaced would likely indicate a flatter area, while closer lines can indicate a more elevated one.
Students in an engineering design technology program should also keep in mind that there are various other methods for contour mapping that don’t involve old-fashioned maps, including computer-generated terrain models, geological maps, and aerial photography. Either way, understanding how to interpret these maps is a fantastic skill to have for your engineering design career.